Implied Move and Implied Volatility: How Options Price Earnings
 Bek Iigilikov
The implied move is the share price swing, up or down, that the options market is pricing for an earnings report. You find it by dividing the price of the at-the-money straddle in the first expiration after the report by the stock price: before Apple's November 2, 2026 report, that straddle cost $14.98 on a $347.10 stock, an implied move of about 4.3%.
Implied volatility (IV) is the number behind that price. It is the annualized volatility that makes an option's market price fit a pricing model, so it tells you how big a move traders are paying for, not which way the stock will go.
This guide is for self-directed investors who hold stocks through earnings or trade options around reports. You will learn to calculate an implied move, judge whether it is cheap or expensive, and decide whether to trade, hedge or wait.
Key takeaways
Implied move = at-the-money straddle price ÷ stock price, using the first expiration after the earnings report.
Apple's November 4, 2026 straddle priced a 4.3% move; Apple fell 2.18% the session after its report, and the straddle seller kept about 86% of the premium.
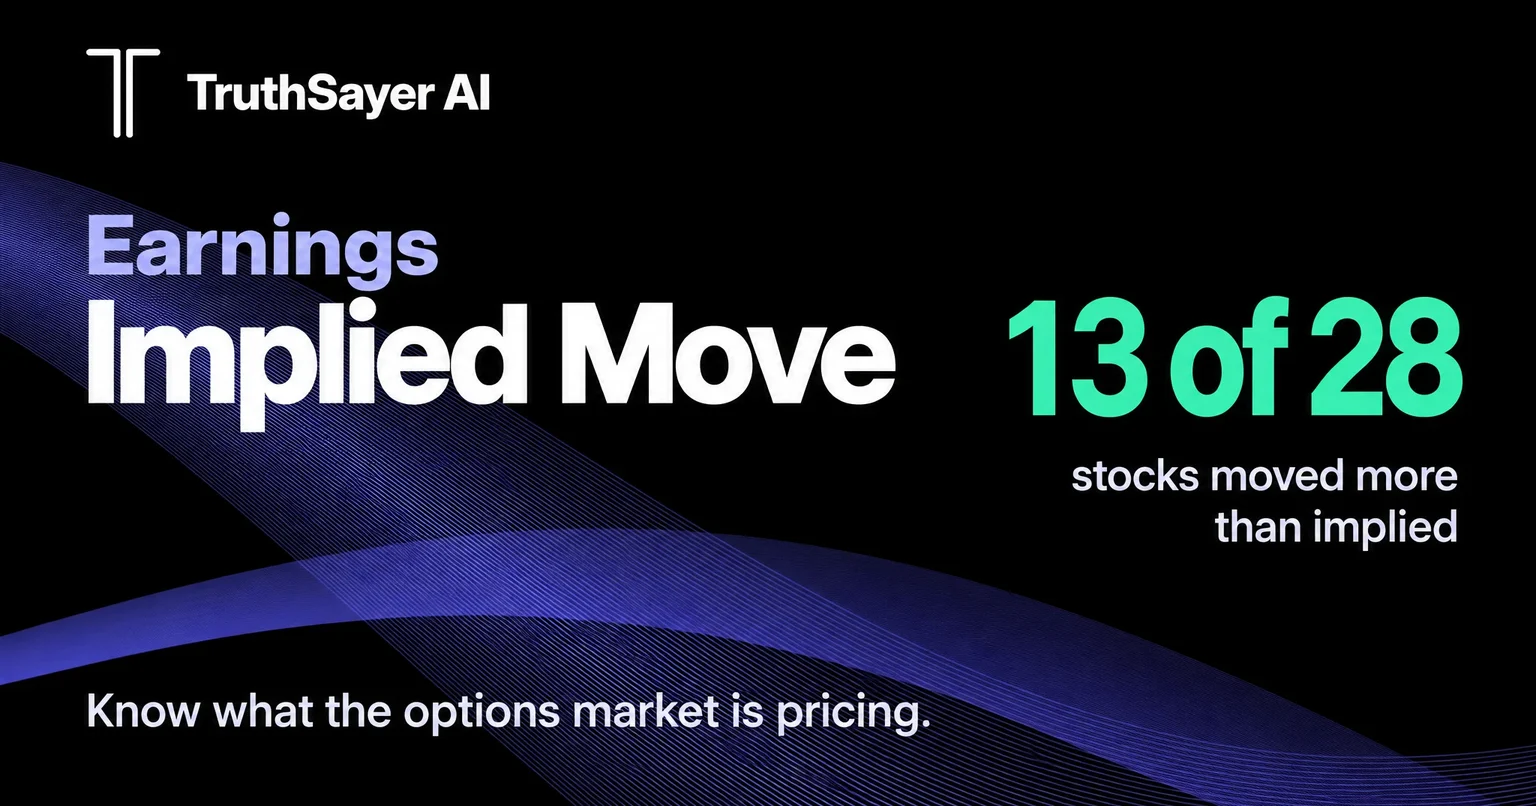
In our check of 28 earnings reports in the week of October 26, 2026, 13 stocks moved more than their straddle implied, and the average move (8.56%) was larger than the average implied move (6.83%).
Selling the implied move wins often and loses big: TruthSayer's Earnings AI won 83.8% of 142 live credit spreads, but its average return was just +0.10% per trade.
Options do not always overprice earnings: a 2018 study found straddles bought three days before reports returned 3.34% on average.
What is implied volatility, and how does it work?
Implied volatility is the market's estimate of how much a stock will move, read backward from option prices. An option pricing model such as Black-Scholes takes the stock price, strike, time, interest rate and volatility and returns a price. Every input except volatility is known, so traders solve for the volatility that matches the price in the market.
IV is quoted as an annualized percentage. A stock with 32% IV is priced as if it will move about 32% either way over a year, roughly two times out of three. IV says nothing about direction.
Historical volatility (HV) measures how much a stock actually moved over a past period. Implied volatility measures how much the options market expects it to move. The gap between the two shows whether options look expensive or cheap.
Why does implied volatility rise before earnings?
Implied volatility rises before earnings because one scheduled event can move a stock more than a normal month. Options that expire after the report must pay for that jump, so their IV climbs into the release.
After the report, IV drops, often overnight. Traders call this the IV crush. An option can lose value after earnings even when the stock moved the buyer's way.
What is the VIX?
The Cboe Volatility Index (VIX) is the 30-day implied volatility of the S&P 500, calculated from index option prices. The VIX averaged 19.4 from 1990 to November 2026, peaked at 82.69 on March 16, 2020, and averaged 18.2 so far in 2026.
Implied volatility over time: VIX annual average, 2007–2026
What is an implied move, and how do you calculate it?
The implied move is the price swing the options market is charging for over a period that includes an event. There are two standard ways to calculate it.
Method 1: the straddle price
A straddle is one call and one put at the same strike and expiration. Its price is roughly the average move the market expects, in either direction.
- Pick the expiration. Choose the first expiration after the earnings date. An earlier expiration does not include the report.
- Pick the strike. Use the strike closest to the current share price.
- Add the call and the put. Use the midpoint of each bid and ask, because spreads widen before a report.
- Divide by the share price. Implied move = straddle price ÷ share price. The expected range is the share price plus or minus the straddle.
Method 2: the implied volatility formula
The second method converts IV into a one-standard-deviation move: expected move = share price × IV × √(days to expiration ÷ 365). Dividing IV by 16, close to √252 trading days, gives a quick daily move.
Under the normal distribution used in the models, the average move is about 0.8 times one standard deviation, so a straddle is close to 0.8 of the IV-based move. Neither number is a boundary: a stock finishes beyond one standard deviation about a third of the time.
To turn the VIX into an expected daily S&P 500 move, divide it by 16. On November 5, 2026, the VIX closed at 28.18, which works out to an expected daily move of about 1.78%, or about 8.1% over 30 days (28.18% × √(30 ÷ 365)).
How did Apple's implied move play out? A worked example
Apple's November 2026 report shows the full cycle, from the price of the implied move to what buyers and sellers ended up with. Apple reported after the close on Monday, November 2, 2026. The quotes are from Saxo, after the October 27 close.
- Find the stock price and strike. Apple closed at about $347.10. The nearest strike was $347.50.
- Price the straddle. The November 4 call cost about $7.23 and the put about $7.75. $7.23 + $7.75 = $14.98.
- Calculate the implied move. $14.98 ÷ $347.10 = 4.3%. The expected range was $347.10 ± $14.98, or $332.12 to $362.08.
- Check later expirations. The same strike cost about $17.96 for November 13. Seven more sessions added only $2.98, so most of the $14.98 paid for the report.
- Measure the reaction. Apple closed at $339.11 on November 2 and $331.72 on November 3, a fall of 2.18%. That is about half of the 4.3% implied move.
- Settle the straddle. Apple closed at $349.60 on the November 4 expiration day. The $347.50 call was worth $2.10 and the put expired worthless, so the straddle was worth $2.10.
- Count the result. A buyer paid $14.98 and got back $2.10, a loss of $12.88 per share, or about 86% ($1,288 per contract before commissions). A seller kept that $12.88.
Apple's EPS of $2.10 beat the $1.99 consensus, as our earnings surprise guide explains, yet the stock never left the range the options had priced.
Price moves are TruthSayer AI calculations from Intrinio 15-minute bars, using the last regular-session bar each day. Option payoffs exclude commissions and bid-ask costs.
Do stocks actually move as much as options imply?
Most stocks move less than their implied move, but the few that move more can move far more. We tested this on every company in TipRanks' implied-move list for the week of October 26, 2026: 28 earnings reports, all priced with the same straddle method. This is our own research.
Method. We took each implied move as TipRanks published it before the open on October 26 and measured the share price change from the October 23 close to the October 30 weekly expiration. That window matches a straddle bought on October 23 and held to expiration.
Implied move vs actual move: eight earnings reports, week of Oct 26, 2026
Implied move (straddle)Actual move, size
Thirteen of the 28 stocks, or 46%, moved more than their implied move. The median stock moved only 0.78 times its implied move, so a straddle seller won on the typical report. But the average move was 8.56% against an average implied move of 6.83%, because three reports blew far past the range: ServiceNow fell 33.87%, Teladoc rose 34.17% and Intel fell 24.36%.
| Stock | Implied move | Actual move, Oct 23–30 | Actual ÷ implied |
|---|---|---|---|
| ServiceNow | ±10.25% | −33.87% | 3.30 |
| Teladoc | ±11.83% | +34.17% | 2.89 |
| Intel | ±9.95% | −24.36% | 2.45 |
| Alphabet | ±6.05% | −12.60% | 2.08 |
| Eli Lilly | ±6.58% | +11.11% | 1.69 |
| Gilead | ±5.83% | +9.42% | 1.62 |
| Boeing | ±5.73% | −8.90% | 1.55 |
| SoFi | ±9.65% | +14.68% | 1.52 |
| BigBear.ai | ±14.49% | +21.55% | 1.49 |
| Coinbase | ±9.48% | −12.69% | 1.34 |
| Strategy | ±8.45% | −10.63% | 1.26 |
| Altria | ±3.97% | +4.98% | 1.25 |
| Caterpillar | ±7.75% | −9.33% | 1.20 |
| Ford | ±6.29% | +5.61% | 0.89 |
| AbbVie | ±4.78% | +3.21% | 0.67 |
| Mastercard | ±3.63% | +2.35% | 0.65 |
| Merck | ±5.19% | +2.93% | 0.56 |
| Exxon Mobil | ±3.93% | +2.21% | 0.56 |
| Starbucks | ±5.74% | +2.82% | 0.49 |
| Coca-Cola | ±3.31% | +1.51% | 0.46 |
| Visa | ±3.44% | +1.39% | 0.40 |
| Amazon | ±7.86% | −3.08% | 0.39 |
| Bristol Myers Squibb | ±5.47% | +1.61% | 0.29 |
| Rivian | ±10.40% | +2.96% | 0.28 |
| Chevron | ±3.87% | +1.00% | 0.26 |
| Microsoft | ±5.24% | −0.48% | 0.09 |
| Verizon | ±4.43% | +0.27% | 0.06 |
| PayPal | ±7.70% | 0.00% | 0.00 |
One week is a small sample, and it includes market moves as well as the reports. Still, the pattern is clear: sellers collect on most reports and give a large share back on a few.
How do you tell if an implied move is cheap or expensive?
An implied move is cheap or expensive only compared with the same stock's past reactions. Average the absolute close-to-close move after its last eight reports and compare it with today's implied move.
Before Alphabet's October 28, 2026 report, Cboe LiveVol data cited by CNBC showed a 5.8% implied move against a 2.7% average reaction over two years. Microsoft's implied move was under 5%, below its 2-year average swing of 6%. By the history test, Alphabet looked expensive and Microsoft cheap. Alphabet then fell 12.85% the next session, and Microsoft moved 0.24%.
| Implied move vs the stock's average past earnings move | What it suggests | Who it tends to favor | Watch out for |
|---|---|---|---|
| Below 0.8× | Options look cheap | Buyers of straddles or spreads | A quieter company than before (new guidance policy, smaller business risk) |
| 0.8× to 1.2× | Fairly priced | Nobody; the edge must come from elsewhere | Trading for its own sake |
| 1.2× to 2× | Options look expensive | Sellers of defined-risk spreads | A real change in the story, like Alphabet in October 2026 |
| Above 2× | Market expects something unusual | Usually no one without an information edge | Binary news: drug trials, lawsuits, guidance resets |
These bands are our rule of thumb, not a published standard. A 2023 study by Jonathan Milian supports the idea: weekly straddle returns were significantly higher when a company's historical earnings move was high relative to its implied move.
A high IV rank a few days before earnings tells you little on its own. Almost every liquid stock has high IV right before its report, so a screener sorted by IV rank is mostly finding the earnings calendar.
How do the main ways to trade the implied move compare?
Each earnings strategy is a bet on whether the stock will move more or less than the implied move, with different risk. The table compares the common choices, including not trading options at all.
| Approach | You win if | Maximum loss | Best for | Weak spot |
|---|---|---|---|---|
| Buy a straddle | The stock moves more than the implied move, either way | The premium paid | Traders who expect a bigger surprise than the market | IV crush; loses on most reports |
| Sell a straddle or strangle | The stock moves less than the implied move | Unlimited on the call side | Professionals with large accounts and margin | One gap like ServiceNow's can erase months of gains |
| Sell a credit spread or iron condor | The stock stays above (or below) your short strike | Spread width minus credit | Disciplined traders who size small | Small wins, rare full losses |
| Buy a call or put | The stock moves far enough in your direction | The premium paid | Traders with a directional view | Needs direction and size; IV crush still applies |
| Hold the stock, no options | The business does well over months | The full gap on the stock | Long-term investors | No protection from an overnight gap |
| Follow a live-traded signal service | The service's process has an edge after costs | Depends on the service's sizing | Investors without time to build a process | Only useful if every trade, including losers, is public |
Pros and cons
- Long straddle: limited risk and big upside on a shock, but you pay for the IV crush every time.
- Short straddle: the most premium, but an open-ended loss.
- Credit spread or iron condor: defined risk and a high win rate, but one loss equals many wins.
- Stock only: simple, but you carry the full gap risk.
No approach is best for everyone. The right choice depends on account size and how much loss you can accept in one night.
Which approach fits you, and what does it cost?
The implied move helps anyone who holds a stock through a report.
Best for long-term investors: use it as a risk gauge
The implied move shows how big a gap to expect. A 7.86% implied move on Amazon meant a $10,000 position could swing about $786.
Best for earnings traders: compare implied with history
The implied move is your price. Trade only when it looks clearly cheap or expensive against the stock's past reactions, with defined-risk spreads.
Best for beginners: watch, do not sell
Track implied versus actual moves for a season before trading, and never start by selling naked options.
Who it is not right for
Selling earnings premium is not right for accounts that cannot absorb a full spread loss, for anyone who would add to a losing trade, or for investors who do not have options approval and margin from their broker.
Cost, time and effort
- Data: most brokers show option chains and IV free. Past implied moves need a paid service or your own records.
- Trading costs: commissions, plus bid-ask spreads that are widest just before a report. Earnings AI's spreads paid $12.49 in commissions on a five-contract trade.
- Time: about 20 minutes per stock before the report, and a few minutes after it.
What are the risks and common mistakes with implied moves?
The biggest risk is treating the implied move as a promise. Real earnings moves have fatter tails than the models assume.
- Using the wrong expiration. A monthly option includes weeks of ordinary trading. On October 20–21, Amazon's weekly straddle priced about 7.5% and the November monthly about 9.5%, according to MenthorQ.
- Ignoring the IV crush. A call bought before earnings can lose money even when the direction is right.
- Selling because "options are always overpriced". Thirteen of 28 stocks broke their range in one week of October 2026.
- Sizing for the typical outcome. Size every spread for its maximum loss.
- Trusting one stock's streak. Nvidia moved less than its implied move after eight reports in a row, according to ORATS data. Before its August 26, 2026 report, options priced a 5.4% move; Nvidia rose 8.63% the next session.
The honest limit of the implied move is that it describes size, never direction, and it includes every event in the expiration window, such as a Fed meeting the same week.
Do options always overprice earnings moves?
No. Common trading advice says options are always too expensive before earnings, so you should sell them. Some of the evidence points the other way.
Chao Gao, Yuhang Xing and Xiaoyan Zhang studied straddles on individual stocks in the Journal of Financial and Quantitative Analysis. Straddles in general earned negative returns, but at-the-money straddles held from three days before an earnings announcement to the announcement date earned a highly significant 3.34% on average.
"The positive returns on straddles indicate that investors underestimate the magnitude of uncertainty around earnings announcements."
— Chao Gao, Yuhang Xing and Xiaoyan Zhang, authors, Journal of Financial and Quantitative Analysis (2018)
The effect was strongest in smaller, more volatile companies. Our October 2026 week points the same way: sellers won 15 of 28 times, but the average move beat the average implied move. Selling earnings premium has a high win rate, not a guaranteed edge.
The TruthSayer Implied Move Check: six steps before any earnings trade
We use these six steps before trading a report or holding a large position through one.
- Price the move. Add the at-the-money call and put in the first expiration after the report and divide by the share price.
- Isolate the event. Compare with the next expiration out. If the later straddle costs only a little more, most of the price is the report.
- Check the history. Average the stock's absolute move after its last eight reports and divide the implied move by it.
- Name the tail. Write down what could cause a move of two times the implied move: guidance, a lawsuit, a product result.
- Size for the worst case. Set position size so the maximum loss fits your rules. At TruthSayer, no position is more than 5% of the portfolio.
- Set the exit before the report. Decide in advance whether you will close at the open, at expiration or at a stop, and follow it.
How does TruthSayer AI use the implied move?
Earnings AI trades around earnings reports in a funded account, mainly with stock positions opened one to four hours before the report. On some reports it also sells option spreads that profit if the stock stays inside a range. Every trade, including losers, stays on the public list.
A winning spread: PepsiCo, April 2026
- The trade. On April 15, 2026, Earnings AI sold five PepsiCo $146/$141 bull put credit spreads expiring April 17, for a credit of $0.40 per share, or $200 in total.
- The risk. The spread was $5 wide. Maximum loss = ($5.00 − $0.40) × 500 shares = $2,300.
- The cushion. PepsiCo closed at $154.74 on April 15, so the $145.60 breakeven sat 5.91% below.
- The report. PepsiCo reported before the open on April 16: EPS of $1.70, up 27%. The stock closed at $158.34 that day and $157.67 on April 17.
- The result. Both puts expired worthless. Net profit = $200 − $12.49 commissions = $187.51, or 8.15% of the $2,300 at risk.
A losing spread: eBay, October 2025
On October 29, 2025, Earnings AI sold eBay $90/$85 bull put credit spreads expiring October 31. eBay fell through both strikes, and the trade lost $2,232.49, or 101.94% of the $2,190 at risk after commissions. That one loss was almost 12 times the PepsiCo gain.
How selling earnings premium pays: Earnings AI credit spreads, 2025–2026
Across 142 closed credit spreads and iron condors from March 2025 to April 2026, Earnings AI won 83.8% of trades. The median trade returned +7.34% of capital at risk, but the average loss was −41.0% and seven trades lost more than 75%. The average return per trade was +0.10%, and net profit was $6,158.88 on $279,187 put at risk. The median trade lasted one day.
That is selling the implied move with real money: a high win rate and a thin edge, which is why each position is capped at 5% of the portfolio. As of November 9, 2026, the Earnings AI page shows a 31.85% return since inception against 35.09% for the S&P 500 over the same dates, a 72.8% win rate across all trades, a Sharpe ratio of 3.94 and a beta of 0.30. TruthSayer AI claims compliance with GIPS®, the global performance reporting standard; see our GIPS reports and verification.
The 28-stock test uses every company in TipRanks' October 26, 2026 list, with Alphabet counted once, so we did not pick winners. The Apple example uses Saxo's quotes because they show both legs. Earnings AI figures include every closed credit spread and iron condor on its trade list on November 9, 2026; debit spreads and single options are a different bet and were left out.
What should you do next with the implied move?
- You own a stock that reports soon: multiply the implied move by your position size. If that swing is more than you can accept overnight, trim first.
- You want to trade the report: run the TruthSayer Implied Move Check, and trade only when the implied move is clearly out of line with history.
- You already placed the trade: follow the exit you set. Do not roll or add to a losing spread to avoid taking the loss.
- After the report: log the implied move, the actual move and your result.
To go deeper, read how to trade earnings, post-earnings announcement drift and how to judge a signal service. For basic terms, see the glossary entry on options.
The bottom line: The implied move is the price of an earnings report: the at-the-money straddle divided by the share price. In the week of October 26, 2026, the typical stock moved less than implied, but 13 of 28 broke the range and three moved more than twice as far. Use the TruthSayer Implied Move Check to price the move, compare it with history and size for the worst case. Long-term investors should use it to size positions; traders should sell or buy it only with defined risk.
Frequently asked questions
What is implied volatility in simple terms?
Implied volatility is how much the options market expects a stock to move, expressed as an annual percentage and backed out of option prices. Higher IV means more expensive options. The VIX, the S&P 500's 30-day implied volatility, averaged 19.4 from 1990 to November 2026 and closed at 28.18 on November 5, 2026.
How accurate is the implied move?
The implied move is a market price, not a forecast of the exact move. In our test of 28 reports in the week of October 26, 2026, the median stock moved 0.78 times its implied move, but 13 stocks moved more than implied, and ServiceNow moved 3.3 times its implied move.
Is high implied volatility good for buying options?
High implied volatility makes options more expensive, which usually favors sellers. A buyer needs a move larger than the implied move to profit, and the IV crush after the report removes value overnight. Gao, Xing and Zhang (2018) found pre-earnings straddles still earned 3.34% on average, mainly in smaller, more volatile companies.
What is IV crush?
IV crush is the sharp drop in implied volatility after an event such as an earnings report, once the uncertainty is resolved. It lowers option prices even if the stock moves. Apple's November 4, 2026 straddle fell from about $14.98 to $2.10 at expiration, although Apple fell 2.18% after its report.
The stock moved more than the implied move against my spread. What should I do?
Follow the exit you set before the report. A defined-risk spread cannot lose more than its width minus the credit, so do not roll it or add to it to avoid booking the loss. Earnings AI took a 101.94% loss on an eBay spread in October 2025 and kept its 5% position cap.
How often should I check a stock's implied move?
Check it once a few days before each report, and again just before the close on report day, because the straddle changes daily. After the report, record the actual move. Comparing your last eight reports gives you the history test used in the TruthSayer Implied Move Check.
Sources
- Saxo, Koen Hoorelbeke, Apple earnings: where the options market puts the price of the report (quotes after the Oct 27, 2026 close)
- TipRanks, Options Volatility and Implied Earnings Moves This Week, October 26 – October 30, 2026 (Oct 26, 2026)
- CNBC, Alphabet, Microsoft report after the bell. What options traders see (Oct 28, 2026)
- Reuters, Nvidia shares set for $280 billion price swing after earnings, options show (Aug 25, 2026)
- ORATS, Nvidia options price the quietest earnings reaction since 2021 (Aug 26, 2026)
- MenthorQ, Amazon earnings options: trading AMZN's Oct 29 report (Oct 23, 2026)
- Gao, Xing and Zhang, Anticipating Uncertainty: Straddles around Earnings Announcements, Journal of Financial and Quantitative Analysis (2018)
- Milian, The Efficiency of Weekly Option Prices around Earnings Announcements, Journal of Risk and Financial Management (2023)
- Federal Reserve Bank of St. Louis, FRED, CBOE Volatility Index: VIX (VIXCLS) (data through Nov 5, 2026)
- PepsiCo, First-Quarter 2026 Results press release (Apr 16, 2026)
- Charles Schwab, Using Implied Volatility Percentages and Rankings (Jun 15, 2026)
- Intrinio share price data via truthsayer.com, 15-minute bars (retrieved Nov 9, 2026)
- TruthSayer AI, Earnings AI performance and trade list (Nov 9, 2026)
This article is for educational purposes only and is not investment advice. Past performance does not guarantee future results.
Bek Iigilikov
Bek brings a strategic, data-driven perspective to investment research, market intelligence, and portfolio growth at TruthSayer AI. He focuses on quantitative investment strategies, financial analytics, and U.S. equities, with an approach that emphasizes disciplined investing, transparency, and informed decision-making over speculation and hype.