Short Interest: What It Means for a Stock
 Bek Iigilikov
Short interest is the number of a company's shares that investors have sold short and not yet bought back. High short interest means many investors are betting the stock will fall, but in our test of 1,920 US stocks it did not mean a short squeeze was coming.
Short selling means borrowing shares, selling them and hoping to buy them back cheaper later. Short interest adds up all of those open bets on one date. FINRA collects the numbers from brokers twice a month and publishes them about a week and a half later.
This guide is for self-directed investors who see "short interest" on a stock page and want to know what it means. You will learn to calculate short interest, judge whether it is high, and use it as a warning light rather than a trading signal.
Key takeaways
Short interest is the total of shares sold short and not yet covered, as of a FINRA settlement date. It is usually shown as a percentage of shares outstanding or float, and as days to cover.
The median US stock had 5.35% of its shares sold short on October 30, 2026, by our count of 2,553 NYSE and Nasdaq stocks. Only 4.2% of stocks had short interest of 20% or more.
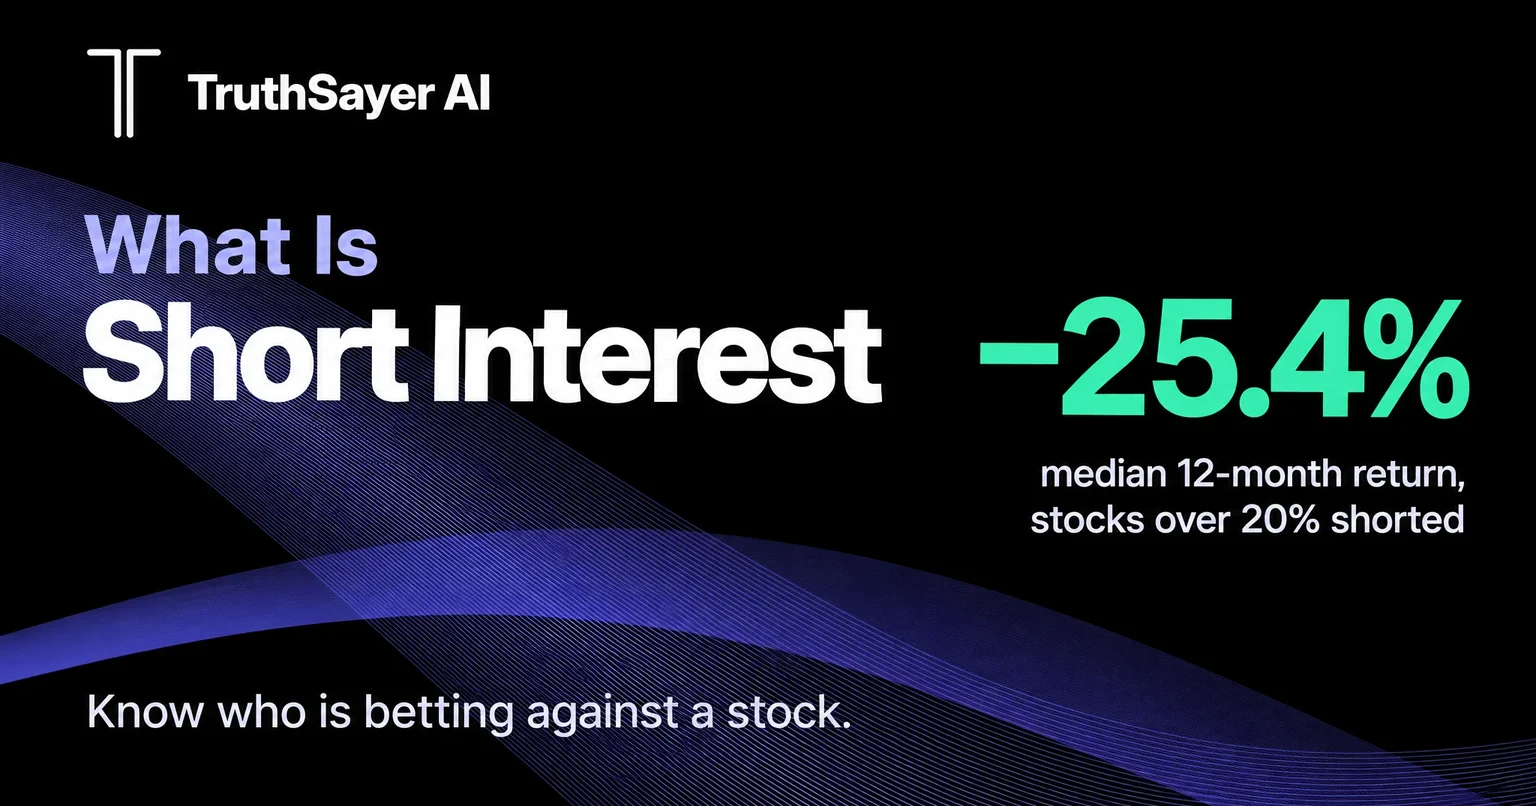
Stocks with short interest of 20% or more on October 31, 2025 had a median 12-month price return of −25.4%, against +2.77% for the S&P 500 ETF. 45.9% of them fell by more than 30%.
Short interest data is old when you see it. FINRA publishes it on the seventh business day after each settlement date, so the number describes positions that are 11 to 26 days old.
SEC staff found that short covering was "a small fraction" of buying during the 2021 GameStop rally. High short interest is a sign of risk, not a squeeze forecast.
What is short interest and how does it work?
Short interest is a snapshot of every open short position in one stock on one date. FINRA describes it as "a snapshot of the total open short positions existing on the books and records of brokerage firms" on a given settlement date.
A short seller borrows shares from a broker, sells them, and must later buy the same number of shares to return them. Until that buyback, called covering, the position counts toward short interest. If the price falls, the short seller profits. If it rises, the loss has no upper limit.
Short interest is the number of shares sold short and not yet covered. Short interest as a percentage of shares outstanding divides that number by all the shares a company has issued. Days to cover divides it by average daily trading volume.
How is short interest reported?
FINRA Rule 4560 requires broker-dealers to report short positions in all customer and proprietary accounts twice a month: around the 15th and on the last business day of the month. Reports are due two business days after the settlement date.
FINRA publishes the totals on the seventh business day after the settlement date. Data for November 13, 2026 is due from brokers on November 17 and published on November 24.
What are the three ways to express short interest?
- Shares short: the raw count, such as 13.1 million shares, which is hard to compare across companies.
- Short interest as a percentage of shares outstanding or float: shares short divided by all shares issued, or by the float. Float excludes insider and locked-up shares, so that figure is higher.
- Days to cover, also called the short interest ratio: shares short divided by average daily volume. It estimates how many normal days short sellers need to buy back every share.
Can short interest be more than 100%?
Yes, because a share bought from a short seller can be lent and shorted again. GameStop's short interest peaked at 109.26% of its shares on December 31, 2020, according to the SEC staff report on the January 2021 trading.
How do you calculate short interest? A worked example with Carvana
You calculate short interest as a percentage by dividing FINRA's shares-short figure by the company's shares outstanding, and days to cover by dividing it by average daily volume. Here is the full calculation for Carvana (CVNA) on October 7, 2025, the day TruthSayer's Dark Pools AI opened a short position in the stock.
- Find the latest published short interest. On October 7, 2025, the newest FINRA data was for the September 15, 2025 settlement date, published September 24. It showed 13,124,908 Carvana shares sold short.
- Find shares outstanding. Carvana has two share classes, and only Class A trades on the NYSE. Its 10-Q for the quarter ended June 30, 2025 lists 138,083,496 Class A shares outstanding as of July 28, 2025.
- Divide. 13,124,908 ÷ 138,083,496 = 9.5% of Class A shares sold short.
- Calculate days to cover. FINRA's average daily volume for that period was 2,201,169 shares. 13,124,908 ÷ 2,201,169 = 5.96 days.
- Check the trend. The August 29, 2025 figure was 13,725,425 shares, so short interest had fallen 4.4% in two weeks: bears were covering.
- Check how old the data is. The September 15 snapshot was 22 days old on October 7. The next report, for September 30, showed 11,904,824 shares short, down another 9.3%, but FINRA did not publish it until October 9, two days after the trade.
The reading on October 7 was elevated but not extreme: 9.5% short, close to the top quarter of US stocks by our October 2026 count, with almost six days to cover. On its own it gave no signal: the crowd of bears was already shrinking.
What did the trade do?
Dark Pools AI shorted Carvana because of a dark pool print, not because of short interest. Its alert reported a 562,000-share off-exchange trade, equal to 22% of average daily volume. The model shorted at $371.40 with a trailing stop 18% above entry.
- Entry. Short 5 shares at $371.40 = $1,857.00 of exposure, on October 7, 2025.
- Exit. Covered at $325.24 on October 22, 2025: 5 × $325.24 = $1,626.20.
- Profit. $1,857.00 − $1,626.20 = $230.80 gross, minus a $9.98 commission = $220.82.
- Return. $220.82 ÷ $1,857.00 = +11.89% net in 15 days, as the exit alert reported.
Always write the settlement date next to a short interest figure. "9.5% short as of September 15" is a fact. "9.5% short" with no date can be three weeks out of date.
What is a high short interest, and what is normal?
A short interest below 5% of shares outstanding is normal for a US stock, 10% to 20% is high, and above 20% is extreme. Those bands come from our count of 2,553 NYSE and Nasdaq stocks on October 30, 2026, where the median was 5.35% and the 90th percentile was 14.74%.
What is a normal short interest? Share of US stocks by short interest level, October 30, 2026
Charles Schwab describes short interest under 10% as relatively low and 20% or more as relatively high. Our data agrees: only 22.1% of US stocks had 10% or more of their shares sold short in October 2026, and only 4.2% had 20% or more.
How much short interest do well-known stocks have?
Large, widely held companies usually have very low short interest. Apple, Microsoft, Nvidia and Coca-Cola each had about 1% of shares sold short on October 30, 2026, while SoFi and Upstart sat far higher.
Short interest of 8 well-known stocks, October 30, 2026
GameStop, the most famous short squeeze of the decade, had 8.40% of its shares sold short in October 2026. That is far below its 109.26% peak in 2020, though still above the US median of 5.35%.
What is a good days-to-cover number?
The median days to cover across our 2,553 stocks was 4.64 on October 30, 2026, and the 90th percentile was 10.36. Under 3 days means short sellers can exit easily. Above 10 days means the exit is narrow, and a sharp rise could force a scramble.
| Reading | Short interest, % of shares | Days to cover | What it usually means |
|---|---|---|---|
| Low | Under 2% (12.7% of stocks) | Under 3 | Little bearish positioning; normal for mega caps |
| Normal | 2% to 5% (33.3%) | 3 to 5 | Typical hedging and some bearish bets |
| Elevated | 5% to 10% (31.9%) | 5 to 10 | A real bear case exists; find out what it is |
| High | 10% to 20% (17.9%) | Above 10 | Crowded bet; expect large moves both ways |
| Extreme | 20% or more (4.2%) | Above 10 | Serious doubts about the business; high crash and squeeze risk |
Compare a stock with its own history and its peers, not only with these bands. A lender such as Upstart, at 26.79%, will never look like Coca-Cola, at 1.10%.
Does high short interest predict stock returns? Our test of 1,920 stocks
High short interest predicted weak median returns and a much higher chance of a crash in our one-year test. Stocks with 20% or more of their shares sold short had a median price return of −25.41% over the following 12 months, while stocks with 2% to 5% short interest returned a median +7.51%.
Method. We divided FINRA short interest for October 31, 2025 by each company's shares outstanding, grouped the stocks, and measured price returns from November 14, 2025, after the data was public, to November 20, 2026. The chart caption lists the filters.
Short interest and 12-month returns: median return by short interest group, 1,920 US stocks
| Short interest, Oct 31, 2025 | Stocks | Median return | Beat SPY | Fell more than 30% | Rose more than 50% |
|---|---|---|---|---|---|
| Under 2% | 477 | +5.08% | 53.7% | 12.8% | 6.1% |
| 2% to 5% | 730 | +7.51% | 56.3% | 13.4% | 8.9% |
| 5% to 10% | 450 | +2.19% | 49.6% | 19.8% | 12.7% |
| 10% to 20% | 226 | −0.95% | 45.6% | 27.0% | 20.8% |
| 20% or more | 37 | −25.41% | 32.4% | 45.9% | 10.8% |
| All stocks | 1,920 | +4.80% | 52.3% | 17.0% | 10.5% |
Three results stand out:
- The median falls as short interest rises. Above 10% short interest, the typical stock lost money over a year in which the S&P 500 ETF gained 2.77%.
- Both tails get fatter. In the 10% to 20% group, 27.0% of stocks fell by more than 30% and 20.8% rose by more than 50%.
- Days to cover gave no clean pattern. Sorting the same stocks by days to cover, the group above 10 days returned a median +2.05% and the group under 2 days +0.10%.
This is one year, one market regime and only 37 stocks in the top group. Returns exclude dividends, and 4 stocks that stopped trading before November 20, 2026 are left out. Treat it as a check on the research, not as a strategy.
The academic record points the same way over longer periods. Asquith, Pathak and Ritter (2005) found that stocks with high short interest and low institutional ownership underperformed by 215 basis points a month from 1988 to 2002 equal-weighted, and 39 basis points value-weighted. Boehmer, Huszár and Jordan (2010) looked at the other end and found that heavily traded stocks with low short interest earned positive abnormal returns.
Does high short interest mean a short squeeze is coming?
No. High short interest makes a short squeeze possible, but most heavily shorted stocks do not squeeze. In our test, 45.9% of stocks with 20% or more short interest fell by more than 30% over the next year, and only 10.8% rose by more than 50%.
A short squeeze happens when a heavily shorted stock rises fast and short sellers buy back shares to limit their losses, pushing the price higher still. Social media treats high short interest as fuel waiting for a spark. The spark rarely comes.
Even the most famous squeeze was mostly something else. The SEC staff found that short covering was a small part of buying in the January 2021 GameStop rally.
"It was the positive sentiment, not the buying-to-cover, that sustained the weeks-long price appreciation of GameStop stock."
— SEC staff, Staff Report on Equity and Options Market Structure Conditions in Early 2021 (October 2021)
Researchers agree that short sellers tend to be informed. Hong, Li, Ni, Scheinkman and Yan found that a strategy shorting high days-to-cover stocks and buying low ones earned 1.2% a month in their sample.
"We show that days to cover (DTC), the ratio of short interest to trading volume, measures the costliness of exiting crowded trades."
— Harrison Hong, Frank Weikai Li, Sophie X. Ni, José Scheinkman and Philip Yan, NBER Working Paper 21166 (2015)
How does short interest compare with short volume, borrow fees and other gauges?
Short interest is the most reliable free measure of bearish positioning, but it is slow. Short volume is fast but misleading, borrow fees are usually paid data, and the SEC's Form SHO reports will not start until 2028.
| Gauge | What it measures | How fresh | Free? | Best for | Weak spot |
|---|---|---|---|---|---|
| Short interest + days to cover | Open short positions on a settlement date | Twice a month, 11 to 26 days old | Yes | Judging how crowded the bear case is | Lag; shares-outstanding vs float confusion |
| Short volume ratio | Share of each day's off-exchange volume marked "short" | Daily | Yes | Very little on its own | Mostly market makers; not positions |
| Borrow fee and utilization | Cost and scarcity of lendable shares | Daily or intraday | No, mostly | Short sellers and squeeze watchers | Paid vendors; methods differ |
| Institutional flow (dark pool prints) | Large trades by big investors | Same day | Partly | Timing entries and exits | Direction must be inferred |
| Form SHO (Rule 13f-2) | Large managers' short positions, aggregated by the SEC | Monthly, from 2028 | Yes | Future check on short positioning | Compliance delayed to January 2, 2028 |
The biggest trap is short volume. FINRA warns that short sale volume data "does not—and is not intended to—equate to" short interest. Our guide to reading dark pool data found nearly equal short volume ratios for Apple and GameStop in October 2026, with eight times more short interest in GameStop.
Short interest also works best next to ownership data. High short interest plus low institutional ownership is the combination Asquith, Pathak and Ritter linked to the weakest returns.
How should you use short interest? It depends on your goal
Short interest is most useful as a risk check before you buy and least useful as a trigger to trade. How you use it should change with your time horizon, your account size and whether you ever sell short.
Best for long-term value investors: a red-flag check
Before you buy a stock that looks cheap, check its short interest. A reading above 10% means professional investors see a problem, such as falling sales, heavy debt or accounting doubts. It is one of the warning signs in our guide to value traps. Read the bear case first, then decide.
Best for swing traders and earnings traders: the trend and the timing
Traders who hold for days or weeks should watch the change in short interest over two to four reports, plus days to cover. Our study found more big drops as short interest rose, so size positions in crowded stocks smaller, especially into the events covered in how to trade earnings.
Best for short sellers: days to cover and borrow cost
If you sell short, short interest tells you how crowded your trade is. High days to cover means a hard exit if the stock jumps. Check your broker's borrow fee before you open the trade, because hard-to-borrow stocks cost more to short.
Best for beginners: a context number, not a signal
Treat short interest as one line on the stock page, like the P/E ratio. Never buy a stock because it "could squeeze".
Who should not rely on short interest?
Day traders should not rely on short interest, because it is 11 to 26 days old. Investors in broad index funds also gain little from it, because an index fund holds every stock in the index whatever its short interest.
What does it cost, and how long does it take?
- Cost: FINRA's short interest data is free, and most brokers show it on their quote pages. Float-based figures, borrow fees and utilization usually come from paid vendors.
- Time: the five-step check below takes about 10 minutes per stock with a 10-Q and FINRA's data open.
- After you act: recheck at each FINRA release. Short sellers also pay borrow fees, owe the lender any dividends and face unlimited losses.
What are the risks, limitations and common mistakes with short interest?
The main limit of short interest is that it is old, incomplete and easy to misread. These are the five mistakes we see most often:
- Ignoring the date. The Carvana figure available on October 7, 2025 was 22 days old.
- Mixing denominators. Float-based figures run higher than figures based on shares outstanding.
- Confusing short volume with short interest. A 55% short volume ratio does not mean 55% of the stock is shorted.
- Buying for a squeeze. In our test, stocks with 20% or more short interest returned a median −25.41% over a year.
- Reading low short interest as a buy signal. Stocks under 2% short returned a median +5.08%, behind the 2% to 5% group at +7.51%.
Short interest also cannot show who is short or why. Some short positions hedge convertible bonds or other holdings rather than bet against the company.
How should you check a stock's short interest? The TruthSayer Short Interest Check
The TruthSayer Short Interest Check turns short interest into a decision in five steps. Use it before you buy any stock and before you act on any "heavily shorted" headline.
- Date it. Find the settlement date and the publication date. If the data is more than two weeks old, note that the position may have changed.
- Use one denominator. Calculate short interest as a percentage of shares outstanding from the latest 10-Q cover page, and use the same method for every stock you compare.
- Size the crowd. Compare the percentage with the US median of 5.35% and the 90th percentile of 14.74% (October 30, 2026), and compare days to cover with the median of 4.64.
- Read the trend. Compare the last two to four reports. Rising short interest means the bear case is gaining followers; falling short interest means bears are leaving.
- Find the reason. Read the latest earnings release, debt schedule and any published short report. If you cannot explain why investors are short, do not buy and do not short.
How does TruthSayer AI use short interest?
TruthSayer AI does not trade on short interest. Dark Pools AI opens trades when it detects large institutional prints in dark pools, which arrive the same day, while short interest arrives 11 to 26 days late. Short interest is context you can add to any alert.
Dark Pools AI takes both long and short positions in a funded account. As of November 22, 2026, its page reports a 33.33% return since inception against 25.56% for the S&P 500, a 66.8% historical win rate and 307 trades, including losers. Performance is reported under the firm's GIPS-compliant framework.
In the Carvana trade above, short interest was 9.5% and falling, which said nothing on its own. The trigger was the dark pool print. Every trade uses a 5% position size and a trailing stop of three times the stock's average true range (ATR). Live alerts are on the Dark Pools AI page.
The short interest bands in this article come from FINRA data for 2,553 stocks on October 30, 2026, not from opinion. The return study used every stock that met fixed size and liquidity rules on October 31, 2025. We chose Carvana as a closed Dark Pools AI short with all data public.
What should you do next?
Run the TruthSayer Short Interest Check on one stock you own or plan to buy. If short interest is above 10% of shares, write down the bear case before you do anything else.
- Compare short interest with ownership in our guide to institutional ownership.
- Learn why short volume misleads in dark pool data explained.
- Check whether a cheap, heavily shorted stock is a value trap.
- See how big options bets fit with short positioning in unusual options activity.
- Follow live institutional-flow trades, wins and losses, on Dark Pools AI.
The bottom line: Short interest tells you how many investors are betting against a stock, as of a date 11 to 26 days ago. Below 5% of shares is normal, 10% to 20% is high and 20% or more is extreme, and in our 2025–2026 test the extreme group returned a median −25.4%. Use the TruthSayer Short Interest Check as a risk filter, never as a reason to chase a squeeze.
Frequently asked questions
What is a good short interest percentage?
A short interest under 5% of shares outstanding is normal for US stocks. On October 30, 2026, the median across 2,553 NYSE and Nasdaq stocks was 5.35%, and only 22.1% of stocks were at 10% or more. Readings above 20%, seen in 4.2% of stocks, signal serious doubts about the business.
How often is short interest updated?
Short interest is updated twice a month. Brokers report positions as of a mid-month and an end-of-month settlement date, and FINRA publishes the totals on the seventh business day afterward. For example, data for November 13, 2026 is published on November 24, 2026, eleven days after the snapshot.
Is high short interest bullish or bearish?
High short interest is usually bearish. In our study of 1,920 US stocks from November 2025 to November 2026, stocks with 20% or more short interest returned a median −25.41%, and 45.9% fell more than 30%. A minority squeezed higher: 10.8% of that group rose more than 50%.
Can short interest be more than 100% of shares?
Yes. Short interest can exceed 100% because a share bought from a short seller can be lent and sold short again. GameStop's short interest reached 109.26% of its shares outstanding on December 31, 2020, according to the SEC staff report published in October 2021.
What should I do after I find a stock with high short interest?
Find out why investors are short before you act. Read the company's latest 10-Q and earnings release for falling sales, rising debt or dilution, and compare short interest with the last two to four FINRA reports. If you cannot state the bear case in one sentence, skip the stock.
How often should I recheck short interest on a stock I own?
Recheck short interest at each FINRA release, which happens twice a month, and before every earnings report. Act on a sustained change, such as short interest rising for three reports in a row or crossing 10% of shares outstanding, rather than on one noisy reading.
Sources
- FINRA, Equity Short Interest data (consolidated short interest for settlement dates Aug 29, 2025 to Oct 30, 2026; accessed Nov 22, 2026)
- FINRA, Short Interest Reporting dates, 2026 and 2027 (accessed Nov 22, 2026)
- FINRA, "Short Interest – What It Is, What It Is Not" (Jan 25, 2023)
- SEC EDGAR XBRL frames, dei:EntityCommonStockSharesOutstanding (2025 and 2026 filings; accessed Nov 22, 2026)
- Carvana Co., Form 10-Q for the quarter ended June 30, 2025 (filed Jul 30, 2025)
- SEC staff, Staff Report on Equity and Options Market Structure Conditions in Early 2021 (October 2021)
- SEC, Commissioner Crenshaw statement on the extension of Rule 13f-2 and Rule 10c-1a compliance dates (Dec 3, 2025)
- Morgan Lewis, "Short Sale Reporting on Form SHO: Compliance Date Further Extended to 2028" (Dec 9, 2025)
- Charles Schwab, "What Is Short Interest?" (Jun 4, 2024)
- Hong, Li, Ni, Scheinkman and Yan, "Days to Cover and Stock Returns", NBER Working Paper 21166 (2015)
- Asquith, Pathak and Ritter, "Short interest, institutional ownership, and stock returns", Journal of Financial Economics 78(2) (2005)
- Boehmer, Huszár and Jordan, "The good news in short interest", Journal of Financial Economics 96(1) (2010)
- TruthSayer AI, Dark Pools AI performance page and trade list (accessed Nov 22, 2026); Carvana trade alert 40001575 (Oct 7 and Oct 22, 2025)
- Intrinio 15-minute price history via TruthSayer AI (closing bars for Nov 14, 2025 and Nov 20, 2026; accessed Nov 22, 2026)
This article is for educational purposes only and is not investment advice. Past performance does not guarantee future results.
Bek Iigilikov
Bek brings a strategic, data-driven perspective to investment research, market intelligence, and portfolio growth at TruthSayer AI. He focuses on quantitative investment strategies, financial analytics, and U.S. equities, with an approach that emphasizes disciplined investing, transparency, and informed decision-making over speculation and hype.