What Is a Good P/E Ratio?
 Joan Sacdalan
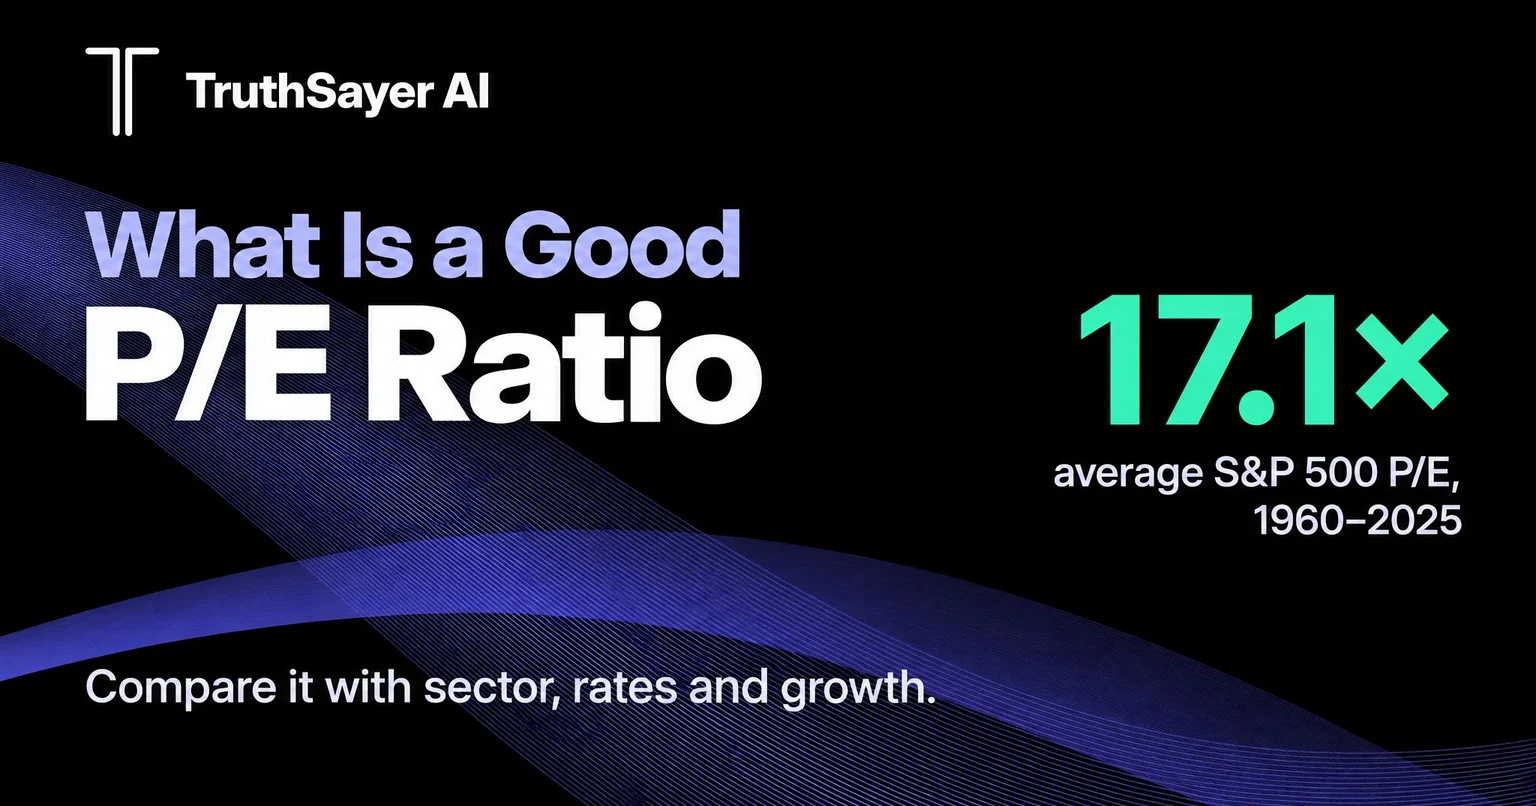
A good P/E ratio is one that is at or below what similar companies trade at, once you account for growth, debt and interest rates. There is no single good number. As a market yardstick, the S&P 500's trailing P/E averaged 17.1× at year-ends from 1960 to 2025, and it stood at 25.2× at the end of 2025.
The price-to-earnings ratio is the most quoted number in investing, and one of the most misread. A P/E of 15 can be expensive for a shrinking business and a P/E of 40 cheap for a fast-growing one.
This guide is for investors who read company filings themselves. You will learn how to calculate P/E from a 10-Q, see the P/E of eight well-known companies at today's prices, compare industries, and see what six decades of data say about P/E and interest rates. You will finish with a five-minute context check you can run on any stock.
Key takeaways
P/E ratio = share price ÷ earnings per share over the last 12 months. Its inverse, the earnings yield, tells you how many cents of profit you buy with each dollar.
The S&P 500's year-end trailing P/E averaged 17.1× from 1960 to 2025, with a median of 17.4×, a low of 7.3× in 1974 and a high of 29.6× in 2001.
Industry matters more than any rule of thumb: in January 2026, large US banks traded at 14.2× trailing earnings and semiconductor companies at 48.8×.
Interest rates move the "normal" P/E: in years when the 10-year Treasury yield ended at 8% or more, the S&P 500 averaged 10.9×; at 4% to 6%, it averaged 19.9×.
Coca-Cola traded at 28.3× trailing earnings on November 4, 2026, 7.7% above the soft-drink industry's 26.3×, a modest premium rather than a bargain.
What is a P/E ratio?
A P/E ratio, or price-to-earnings ratio, is a company's share price divided by its earnings per share (EPS). It tells you how many dollars investors pay for each $1 of the company's yearly profit. A P/E of 20 means investors pay $20 for $1 of earnings.
You can also work it out for the whole company: market value ÷ net income gives the same answer. See the P/E entry in our glossary for a short definition.
Earnings per share (EPS) is net income available to common shareholders divided by the number of shares. Use diluted EPS, which counts shares from options and convertible securities. Every 10-Q and 10-K reports it at the bottom of the income statement.
Trailing P/E vs forward P/E
There are two common versions, and you need to know which one you are looking at:
Trailing P/E (TTM, for trailing twelve months) uses the EPS a company actually reported over the last four quarters. It is a fact you can check in the filings.
Forward P/E uses analysts' forecast EPS for the next 12 months or the next fiscal year. It looks ahead but depends on estimates that can be wrong.
This guide uses trailing P/E throughout, because you can rebuild every number from SEC filings.
What is the earnings yield?
The earnings yield is the P/E turned upside down: EPS ÷ price, or 1 ÷ P/E. A P/E of 25 is an earnings yield of 4%. It is useful because you can set it next to a bond yield. When a stock's earnings yield is below the 10-year Treasury yield, you are accepting less profit per dollar today in return for expected growth.
What is a good P/E ratio?
A good P/E ratio is one that is low relative to the company's own industry, its own history and its growth, at the interest rates of the day. A P/E is only "good" or "bad" in comparison, never on its own.
For a quick sense of scale, the S&P 500's long-run average is the most common anchor. Across 66 year-ends from 1960 to 2025, its trailing P/E averaged 17.1× and the median was 17.4×. Since 1990 the average has been higher, at 19.7×. At the end of 2025 it was 25.2×.
A stock at 12× is cheap by that history and one at 30× is dear, before you ask why. The rest of this guide is about the why.
A P/E only works when earnings are positive. A company with a loss has a negative P/E, which is not meaningful, not "very cheap". Most data sites show it as N/A.
How do you calculate a P/E ratio from a company's filings?
You calculate a trailing P/E by dividing today's share price by the diluted EPS of the last four reported quarters. If the latest filing is a 10-Q, add the year-to-date EPS to the last full-year EPS and subtract the same period from the year before:
TTM EPS = last fiscal year EPS + this year's year-to-date EPS − last year's year-to-date EPS
P/E = share price ÷ TTM EPS
Earnings yield = TTM EPS ÷ share price
Here is the full calculation for Coca-Cola, using its 10-Q for the quarter ended September 2026, filed with the SEC on October 28, 2026:
- Take last year's EPS. Coca-Cola's diluted EPS for fiscal 2025 was $3.04, from its 10-K.
- Add this year to date. Diluted EPS for the first nine months of 2026 was $2.86, from the 10-Q.
- Subtract the same months last year. Diluted EPS for the first nine months of 2025 was $2.51. TTM EPS = $3.04 + $2.86 − $2.51 = $3.39.
- Divide the price by TTM EPS. Coca-Cola closed at $95.80 on November 4, 2026. P/E = $95.80 ÷ $3.39 = 28.26×.
- Turn it into an earnings yield. $3.39 ÷ $95.80 = 3.54%, below the 10-year Treasury yield of 4.95% on November 3, 2026.
- Compare it. The soft-drink industry traded at 26.25× in Damodaran's January 2026 data, so Coca-Cola carried a 7.7% premium. Against the S&P 500's 25.21× at the end of 2025, the premium was 12.1%.
Using fiscal 2025 EPS alone would have given $95.80 ÷ $3.04 = 31.5×. That gap of more than three turns is why the EPS period matters: always check which 12 months a quoted P/E uses.
To see what a price move would mean for a position in dollars, run the numbers in our stock profit calculator.
What do real P/E ratios look like today?
Real P/E ratios for large US companies spread widely, from under 15× for JPMorgan Chase to over 400× for Tesla at the November 4, 2026 close. We calculated each one from diluted EPS in the companies' own SEC filings.
Trailing P/E of eight large US companies, November 4, 2026 close
Three things stand out in the chart:
Nvidia at 25.3× traded below Coca-Cola at 28.3× on trailing earnings. A company known for fast growth does not always carry the highest P/E.
Walmart at 46.8× traded at a higher multiple than Microsoft (29.0×) or Apple (38.9×). A retailer's P/E is not automatically low.
Tesla at about 423× on TTM diluted EPS of $0.91 is off the scale, and Ford had a TTM diluted loss of $1.98 per share, so it had no meaningful P/E at all.
What is a good P/E ratio by industry?
A good P/E ratio by industry is one at or below that industry's typical multiple, because industries with steadier or faster-growing profits usually trade higher. In January 2026, the range ran from 11.3× for homebuilders to 48.8× for semiconductor companies.
Trailing P/E by US industry, January 2026
Damodaran's numbers divide each industry's total market value by its total net income, counting only companies that made money. That is a fairer industry figure than a simple average, which a few firms with tiny profits can push very high. The share of money-losing firms is a reminder of how many companies a P/E screen silently drops:
| Industry (Damodaran name) | Trailing P/E, money-making firms | Share of firms losing money | What drives the multiple |
|---|---|---|---|
| Bank (Money Center) | 14.2× | 7% | Profits tied to credit cycles and rates |
| Oil/Gas (Integrated) | 19.0× | 0% | Profits swing with oil prices |
| Household Products | 19.7× | 72% | Steady demand, slow growth |
| Utility (General) | 20.5× | 0% | Regulated, bond-like profits |
| Beverage (Soft) | 26.3× | 70% | Strong brands, steady cash flow |
| Software (System & Application) | 37.5× | 70% | High margins, fast growth |
| Semiconductor | 48.8× | 62% | Fast growth with deep cycles |
| Auto & Truck | 119.6× | 82% | Thin, volatile profits |
| Total US market | 26.6× | 57% | All 5,994 firms in the dataset |
The highlighted row is Coca-Cola's industry, used in the worked example above. The "what drives the multiple" column is our summary, not part of Damodaran's data. Note that these figures are from January 5, 2026, so they lag today's prices by ten months.
Does a good P/E depend on interest rates? Our research
Yes. In our analysis of 66 year-ends from 1960 to 2025, the S&P 500's trailing P/E was far lower when long-term interest rates were high. When the 10-year Treasury yield ended the year at 8% or more, the average P/E was 10.9×. When it ended between 4% and 6%, the average was 19.9×.
Average S&P 500 P/E by level of the 10-year Treasury yield, 1960–2025
A bond paying 10% competes hard with a stock earning 5% on its price, so investors pay less for earnings when rates are high. The decade averages agree:
| Period | Average year-end P/E | Average 10-year Treasury yield |
|---|---|---|
| 1960s | 17.6× | 4.63% |
| 1970s | 12.1× | 7.49% |
| 1980s | 12.1× | 10.23% |
| 1990s | 20.2× | 6.39% |
| 2000s | 19.3× | 4.16% |
| 2010s | 17.5× | 2.39% |
| 2020–2025 | 23.1× | 3.16% |
The relationship is not tidy. The lowest-rate band (below 4%) averaged 18.7×, slightly less than the 4% to 6% band. Low rates in 2008 to 2012 came with fear: the P/E was 13.8× at the end of 2008 with a 2.21% yield, and 13.0× at the end of 2011 with a 1.88% yield. Rates set the ceiling for P/E; confidence in future earnings decides how close the market gets to it.
The data also shows that P/E can rise because earnings fall. The highest year-end P/E in the series, 29.6× in 2001, came as profits dropped in a recession, and the ratio rose to 18.7× at the end of 2009 for the same reason. A high P/E in a slump can mean depressed earnings, not an expensive market.
At the end of 2025, the S&P 500's earnings yield was 3.97% (1 ÷ 25.21) against a 10-year Treasury yield of 4.18%. When the market's earnings yield sits below the bond yield, investors are counting on growth. Check that a single stock's growth can justify the same bet.
What separates a good P/E from a bad one?
A good P/E is low for a business whose earnings are real, repeatable and growing. A bad P/E looks attractive on the surface but rests on weak, one-off or shrinking earnings. Use these bands as a starting point, then adjust for the industry:
| Trailing P/E | What it usually signals | Check first |
|---|---|---|
| Negative or N/A | The company lost money | Use cash flow, sales or book value instead |
| Under 10× | Deep value or a business in trouble | Falling sales, one-off gains, debt, peak-cycle profit |
| 10× to 20× | Around the market's long-run range | Industry average and 5-year growth |
| 20× to 30× | Quality or growth premium | Whether growth beats the premium you pay |
| 30× to 50× | High expectations | Earnings yield vs bonds, margin trend |
| Over 50× | Very high growth, or very low earnings | Whether earnings are temporarily depressed |
The bands reflect the market's 1960–2025 range of 7.3× to 29.6×. They show where to start digging, not when to buy or sell.
How does P/E compare with other valuation ratios?
P/E is the quickest valuation ratio, but each alternative fixes one of its blind spots. Use P/E to screen, then confirm with a ratio that suits the company:
| Ratio | Formula | Best for | Weak spot |
|---|---|---|---|
| Trailing P/E | Price ÷ last 12 months' EPS | Profitable, steady companies | Useless for losses; distorted by one-offs |
| Forward P/E | Price ÷ forecast EPS | Companies whose profits are changing fast | Relies on analyst estimates |
| PEG ratio | P/E ÷ expected EPS growth rate (%) | Comparing growth companies | Growth forecasts are often wrong |
| CAPE (Shiller P/E) | Price ÷ 10-year average of inflation-adjusted earnings | Judging the whole market | Slow; poor for timing |
| EV/EBITDA | Enterprise value ÷ earnings before interest, taxes, depreciation and amortization | Comparing firms with different debt | Ignores capital spending |
| Price-to-book | Price ÷ book value per share | Banks, insurers, asset-heavy firms | Misses brands and software value |
| Free cash flow yield | Free cash flow per share ÷ price | Checking that profit turns into cash | Lumpy for companies with big projects |
Illustrative example: a stock at 30× earnings with expected EPS growth of 15% a year has a PEG of 2.0. A stock at 20× with 5% growth has a PEG of 4.0. On PEG, the higher P/E looks cheaper, as long as the growth arrives.
Which P/E approach is best for you?
The right P/E approach depends on what you invest in and how much time you spend on each stock:
Best for beginners: trailing P/E against the industry. One division and one comparison catch most obvious overpricing.
Best for dividend and income investors: earnings yield against the 10-year Treasury yield. It shows what you give up by choosing a stock over a bond.
Best for growth investors: forward P/E and PEG. Trailing earnings understate fast-growing companies, so test the forecast instead.
Best for cyclical stocks (autos, steel, energy): P/E on average earnings across a cycle. A low P/E on peak profits is often the most expensive moment to buy.
Best for banks: P/E with price-to-book. Book value anchors a bank's worth in a way it does not for a software company.
What does checking a P/E cost, and how long does it take?
Checking a P/E costs nothing and takes about five minutes per stock. The 10-Q and 10-K are free on SEC EDGAR.
Quick check (2 minutes): read the P/E your broker or a free finance site shows. Confirm whether it is trailing or forward.
Filing check (5 to 10 minutes): rebuild TTM EPS from the latest 10-Q, as in the Coca-Cola example, and look for one-off items in the notes.
Full context check (20 to 30 minutes): add industry, history, rates and cash flow with the framework below.
What are the common P/E ratio mistakes?
The most common P/E mistakes come from comparing the wrong numbers or trusting earnings without reading where they came from:
Treating a low P/E as cheap. A stock at 8× with shrinking profit can be dearer than one at 25× with growing profit.
Comparing across industries. A bank at 14× and a software company at 37× were each close to their industry in January 2026.
Mixing trailing and forward figures. Coca-Cola was 28.3× on TTM EPS and 31.5× on fiscal 2025 EPS at the same price.
Ignoring one-off items. Asset sales, tax benefits and write-downs move net income. Read the notes before you trust the E.
Using simple averages for industries. Damodaran's simple average trailing P/E for semiconductors was 100.2× in January 2026; the aggregate for money-making firms was 48.8×.
Reading a negative P/E as a bargain. Ford's TTM loss of $1.98 per share means the ratio has no meaning.
Is a low P/E always a buy signal? The contrarian view
No. The common advice says to buy stocks with low P/E ratios and avoid high ones. Our view is that a P/E screen is a starting filter, and a strict one hides some of the best opportunities while flagging some of the worst.
The market's "normal" P/E moves. The year-end average was 12.1× in the 1980s and 23.1× from 2020 to 2025. A fixed cutoff such as "buy under 15" would have kept you out of most stocks for most of the last 30 years.
Low P/Es cluster at earnings peaks. Cyclical companies look cheapest when profits are highest, just before they fall. In our margin-of-safety research, free cash flow at Ford and Exxon Mobil went from positive to negative in a single year.
P/E cannot see companies without profits. In Damodaran's January 2026 data, 57% of the 5,994 US firms lost money over the trailing year, so they had no meaningful P/E at all.
Where the advice holds: among steady, profitable companies in the same industry, a lower P/E with similar growth usually is the better price. Use it there, and use something else everywhere else.
How should you judge a P/E? The TruthSayer P/E Context Check
The TruthSayer P/E Context Check is a five-step test that turns a bare P/E into a judgment. Run it in order; stop at any step that fails.
- Check the E. Confirm EPS is positive, diluted and from the last 12 months. Read the notes for one-off gains or charges. If earnings are negative or mostly one-off, stop and value the stock another way.
- Compare with the industry. Put the P/E next to its industry's aggregate P/E. More than 20% above it needs a clear reason, such as faster growth or higher margins.
- Compare with rates. Turn the P/E into an earnings yield and set it against the 10-year Treasury yield. The further below the bond yield it sits, the more growth you are paying for.
- Price the growth. Divide the P/E by the expected yearly EPS growth to get the PEG. Ask whether that growth fits the company's last five years of results in its 10-K filings.
- Confirm with cash. Check that free cash flow per share is at least close to EPS. Then estimate a value range and a buy-below price with our guides to intrinsic value and margin of safety.
Applied to Coca-Cola: EPS of $3.39 is positive, the premium to its industry is 7.7%, and its 3.54% earnings yield sits below the 4.95% bond yield, so steps 4 and 5 decide whether its growth justifies the price.
How does TruthSayer AI use P/E ratios?
TruthSayer's Valuations AI does not buy stocks because their P/E is low. It combines proprietary fair-value models with price action, institutional activity and fundamental financial data to find potentially mispriced US-listed stocks, and every signal is traded in a funded account before members see it.
Zscaler shows why that matters. Its diluted EPS for the fiscal year ended July 31, 2026 was a loss of $0.39 per share, according to its 10-K filed on September 3, 2026, so it had no meaningful P/E and any low-P/E screen would have skipped it. Valuations AI flagged it as undervalued and bought at $184.83 on August 14, 2026, then closed the trade at $230.72 on November 2, 2026, a 24.56% gain over 80 days.
One trade proves nothing, so judge the full record. As of November 5, 2026, the Valuations AI page shows a 78.33% return since inception against 34.36% for the S&P 500, a 72.9% win rate across closed stock trades and an average hold of 75 days. Losses happen too; the same trade list includes Beyond Air, closed at a 101.02% loss in September 2026. TruthSayer AI claims compliance with GIPS®, the global performance reporting standard; see our GIPS reports and verification.
Company P/E ratios use the November 4, 2026 close and diluted EPS we calculated from each company's latest 10-K or 10-Q on SEC EDGAR. Industry and market figures are Damodaran's published data as of January 2026. The interest-rate bands are our own grouping of Damodaran's year-end S&P 500 earnings and 10-year Treasury data. Trade figures come from the published Valuations AI trade list.
What should you do after you check a P/E?
After you check a P/E, decide whether the stock deserves a full valuation. If the context check raises no red flags, estimate what the business is worth and how far below that you want to buy.
Use P/E as one filter among several in our guide to finding undervalued stocks.
Build a value range with a DCF in our intrinsic value guide, then set a buy-below price with our margin of safety guide.
If you follow a signal service, check its live record with our guide to judging a signal service.
See which stocks Valuations AI currently rates as mispriced, with every past trade listed, on the Valuations AI page.
The bottom line: A good P/E ratio is one that is low for the company's industry, its growth and today's interest rates, not a fixed number. The S&P 500's 17.1× long-run average is a useful anchor, but industries ranged from 11× to 49× in January 2026, and the market's normal level has moved with rates for six decades. Run the TruthSayer P/E Context Check before you trust any P/E, and confirm the answer with cash flow.
Frequently asked questions
Is a P/E ratio of 15 good?
A P/E ratio of 15 is below the S&P 500's 1960–2025 year-end average of 17.1×, so it is cheaper than the market's history. Whether it is good depends on the industry: 15× was close to average for large banks (14.2×) in January 2026 but low for soft-drink makers (26.3×). Check that earnings are stable before calling it cheap.
Is a high P/E ratio good or bad?
A high P/E ratio is neither good nor bad on its own. It means investors expect profits to grow, or that current profits are temporarily low. It is bad when the expected growth does not arrive, because the price usually falls toward a lower multiple. Compare the P/E with the company's growth rate using the PEG ratio.
What is the average P/E ratio of the S&P 500?
The average year-end trailing P/E of the S&P 500 was 17.1× from 1960 to 2025, with a median of 17.4×, based on Aswath Damodaran's data at NYU Stern. Since 1990 the average has been 19.7×. At the end of 2025 it was 25.2×.
What does a negative P/E ratio mean?
A negative P/E ratio means the company lost money over the last 12 months, so the ratio has no useful meaning. Ford, for example, had a trailing diluted loss of $1.98 per share in late 2026. Value loss-making companies with sales, cash flow or book value instead, and check how long their cash will last.
Is a lower P/E ratio always better?
No. A lower P/E is better only when the earnings behind it are just as reliable and growing at a similar pace. Low P/Es often appear at the peak of a profit cycle or when a business is shrinking. Among similar, steady companies in the same industry, the lower P/E usually is the better price.
Should I use trailing or forward P/E?
Use trailing P/E as your base, because it rests on reported earnings you can check in 10-Q and 10-K filings. Add forward P/E for companies whose profits are changing quickly, but treat it as an estimate. If the two differ a lot, find out why before you rely on either one.
Sources
- Aswath Damodaran, Price and Value to Earnings by industry sector, NYU Stern (Jan 5, 2026)
- Aswath Damodaran, Historical Implied Equity Risk Premiums (S&P 500 earnings and Treasury yields, 1960–2025), NYU Stern (Jan 2026)
- Coca-Cola 10-Q and 10-K filings, SEC EDGAR (10-Q filed Oct 28, 2026)
- SEC EDGAR company filings and XBRL data for JPMorgan Chase, Procter & Gamble, Nvidia, Microsoft, Apple, Walmart, Tesla, Ford and Zscaler (filings through Nov 3, 2026)
- FRED, 10-Year Treasury Constant Maturity Rate (DGS10) (Nov 3, 2026)
- Intrinio, US equity closing prices (Cboe One) (Nov 4, 2026)
- TruthSayer AI, Valuations AI performance and trade list (Nov 5, 2026)
This article is for educational purposes only and is not investment advice. Past performance does not guarantee future results.
Joan Sacdalan
Joan specializes in financial data analytics, market intelligence, and investment research at TruthSayer AI. Her expertise spans fundamental and technical analysis, emerging market trends, and data-driven investment strategies, turning complex financial data into clear, actionable intelligence for risk-aware investors.