Free Cash Flow: Why It Matters More Than Earnings
 Joan Sacdalan
Free cash flow is the cash a company has left after paying for its operations and its investments in buildings, equipment and data centers. It is the money that can actually go to shareholders, through dividends and buybacks, or pay down debt.
Net income is an accounting opinion; free cash flow is a bank-balance fact. The two usually move together, but when they split, the cash number tells you more about what the business can pay you.
This guide is for investors who pick their own stocks. You will learn how to calculate free cash flow from a 10-K, how it compared with profits at ten large US companies, why Amazon's turned sharply negative in 2026, and how to tell a cash problem from a cash investment.
Key takeaways
Free cash flow = cash from operations − capital expenditures. Both numbers are on the cash flow statement in every 10-K and 10-Q.
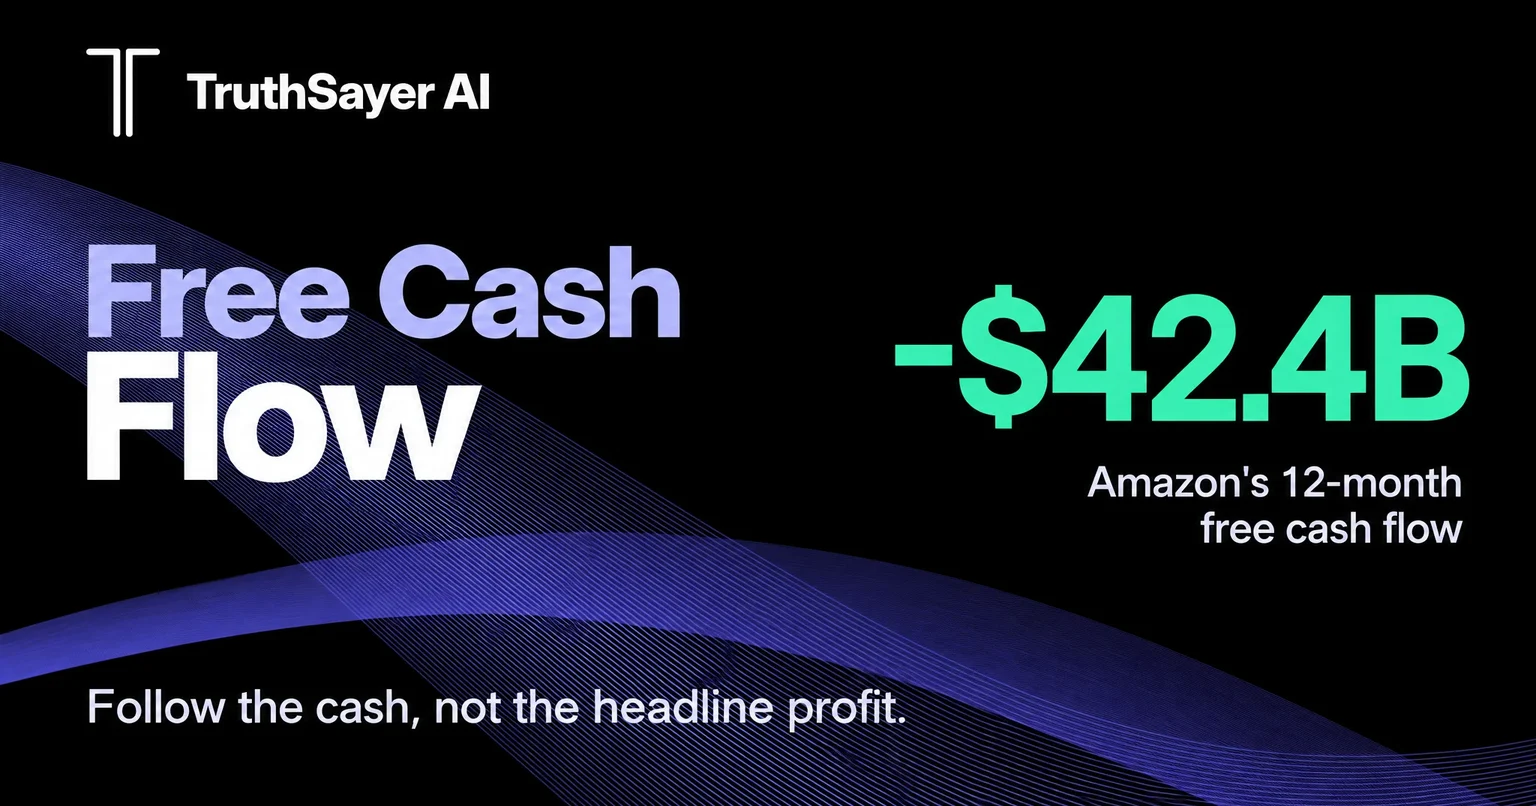
Amazon earned $134.8 billion of net income in the 12 months to September 30, 2026, but its free cash flow was −$42.4 billion, because it spent $210.7 billion on property and equipment.
Across ten large US companies in their latest fiscal year, free cash flow ranged from 102.9% of net income at Apple to 14.4% at Amazon. Microsoft converted 50.1%.
Microsoft's net income rose 52% from fiscal 2024 to fiscal 2026 while its free cash flow fell 10%, because capital spending rose from $44.5 billion to $115.9 billion.
One year of free cash flow is noisy. Judge it over three to five years and adjust for one-time payments, like Coca-Cola's $6.1 billion fairlife payment in 2025.
What is free cash flow?
Free cash flow (FCF) is operating cash flow minus capital expenditures. Operating cash flow is the cash a business brings in from customers after paying suppliers, staff, interest and taxes. Capital expenditures (capex) are what it spends on long-lived assets such as factories, stores, servers and data centers.
Free cash flow matters because it is the only pool of money a company can use to reward shareholders without borrowing or issuing new shares. Dividends, buybacks and debt repayment all come out of it over time.
Free cash flow = net cash provided by operating activities − purchases of property and equipment. Some companies, including Amazon, subtract capex net of asset sales and incentives, and many add other items. Always check how a company defines it before you compare.
Why can free cash flow differ from net income?
Net income follows accrual accounting rules, which record revenue and costs when they are earned or incurred, not when cash moves. Four gaps explain most of the difference:
- Capex versus depreciation: a data center costs cash today but reaches the income statement slowly as depreciation over many years. A company that is building fast has free cash flow well below net income.
- Working capital: sales on credit count as revenue before customers pay. Inventory bought ahead of sales uses cash before it becomes a cost.
- Non-cash gains and losses: a rise in the value of an investment can lift net income with no cash. In Q3 2025, Amazon's net income included $9.5 billion of pre-tax gains from its investment in Anthropic.
- Stock-based pay: shares given to employees are an expense in net income but are added back in operating cash flow, which flatters free cash flow.
What are the main types of free cash flow?
Analysts use a few related measures. The simple version above is the one most companies report and the one you will use most.
| Measure | Formula | Used for |
|---|---|---|
| Free cash flow (simple) | Operating cash flow − capex | Quick checks, FCF yield, comparing companies |
| Free cash flow to the firm (FCFF) | Operating profit after tax + depreciation − capex − change in working capital | Valuing the whole business, debt included |
| Free cash flow to equity (FCFE) | FCFF − interest after tax + net new borrowing | Valuing the shares only |
| FCF margin | Free cash flow ÷ revenue | How much of each sales dollar ends up as cash |
| FCF yield | Free cash flow ÷ market capitalization | Comparing price with cash returned, like an earnings yield |
How do you calculate free cash flow? A Microsoft example
Take Microsoft's fiscal year ended June 30, 2026. All figures come from its 10-K cash flow statement and income statement on SEC EDGAR.
- Find operating cash flow. "Net cash from operations" was $182,935 million.
- Find capital expenditures. "Additions to property and equipment" were $115,948 million.
- Subtract. Free cash flow = $182,935 million − $115,948 million = $66,987 million.
- Put it per share. $66,987 million ÷ 7,453 million diluted shares = $8.99 of free cash flow per share.
- Compare with profit and sales. Net income was $133,749 million, so FCF conversion was $66,987 ÷ $133,749 = 50.1%. Revenue was $331,839 million, so the FCF margin was 20.2%, against a net profit margin of 40.3%.
- Compare with the price. At the November 5, 2026 close of $535.93, Microsoft's market value was about $3,980 billion ($535.93 × 7,426.2 million shares). Its FCF yield was $66,987 million ÷ $3,980 billion = 1.68%.
Microsoft paid $26,445 million in dividends and $22,271 million in buybacks in fiscal 2026, together 72.7% of its free cash flow. The payouts are covered, but with less room than the earnings figure suggests.
What happened to Microsoft's free cash flow?
Microsoft's profit and cash told different stories for three years. Net income rose 52%, from $88,136 million in fiscal 2024 to $133,749 million in fiscal 2026. Free cash flow fell 10%, from $74,071 million to $66,987 million, as capital spending grew 2.6 times, from $44,477 million to $115,948 million.
Microsoft: net income vs free cash flow, fiscal 2019 to 2026
Net incomeFree cash flow
Neither number is wrong. The earnings show a business that is growing fast; the cash shows how much of that growth is being paid for up front. The investor's question is whether the new data centers will earn more than they cost, which no single year of figures can answer.
How much of their profit do big companies turn into cash?
We calculated free cash flow as a share of net income for ten large US companies, using each company's latest fiscal year in its 10-K. This ratio, often called FCF conversion, shows how much of the reported profit became spendable cash.
Free cash flow as a share of net income, latest fiscal year
Three groups stand out:
- Cash-rich and steady: Apple (102.9%) and Procter & Gamble (94.4%) turned almost every dollar of profit into cash. Their capex is small next to their earnings: Apple spent $9,041 million on capex in fiscal 2026 against $145,097 million of operating cash flow.
- Building for AI: Alphabet (55.4%), Microsoft (50.1%) and Amazon (14.4%) converted far less, because of data center spending.
- Distorted by one payment: Coca-Cola's 40.4% looks weak, but its 2025 operating cash flow absorbed a $6.1 billion contingent payment for fairlife. Excluding it, the company put free cash flow at $11.4 billion, or 87.0% of net income.
The lesson is that a low conversion ratio is a question, not an answer. You need to know whether the cash went into growth, into a one-time payment or into a business that is getting weaker.
Why did Amazon's free cash flow turn negative?
Amazon's free cash flow fell from $47.7 billion in the 12 months to September 30, 2024 to −$42.4 billion in the 12 months to September 30, 2026. Over the same two years, its net income rose from $49.9 billion to $134.8 billion.
Amazon: 12-month net income vs free cash flow, Q3 2024 to Q3 2026
Net incomeFree cash flow
The cause is capital spending. In the 12 months to September 30, 2026, Amazon generated $168.3 billion of operating cash flow and spent $210.7 billion on property and equipment, net of proceeds from sales and incentives. That spending was $94.8 billion higher than a year earlier, and Amazon said the increase was mainly for artificial intelligence. Amazon has said it expects about $220 billion of cash capital expenditures for 2026.
A screen that sorts by price-to-earnings sees Amazon trading at about 21 times trailing profit ($260.21 × 10,813 million shares = $2,814 billion, ÷ $134.8 billion). A screen that sorts by free cash flow sees a company that burned $42.4 billion. Both are true, which is why you need to look at both.
For a heavy spender, split capex into two parts: what it takes to keep the business running (maintenance) and what it spends to grow. Companies rarely report the split, but depreciation is a rough stand-in for maintenance capex. Cash flow after only maintenance capex shows what the business could pay out if it stopped growing.
What is a good free cash flow yield?
Free cash flow yield is free cash flow divided by market capitalization. It tells you how much cash the business produces for each dollar you pay for it. A 5% FCF yield means $5 of cash a year for every $100 of stock.
A useful bar is the 10-year US Treasury yield, which was 4.90% on November 4, 2026. A stock with a lower FCF yield only beats a Treasury over time if its free cash flow grows. At the November 5, 2026 close, every company below was priced for growth:
| Company (latest fiscal year) | Free cash flow | Market value, Nov 5, 2026 | FCF yield | Above 4.90% Treasury? |
|---|---|---|---|---|
| Procter & Gamble (FY Jun 2026) | $15.1B | $387B | 3.91% | No |
| Apple (FY Sep 2026) | $136.1B | $5,002B | 2.72% | No |
| Nvidia (FY Jan 2026) | $96.7B | $4,377B | 2.21% | No |
| Microsoft (FY Jun 2026) | $67.0B | $3,980B | 1.68% | No |
| Walmart (FY Jan 2026) | $14.9B | $1,013B | 1.47% | No |
| Coca-Cola (2025, as reported) | $5.3B | $412B | 1.29% | No |
| Coca-Cola (2025, excl. fairlife payment) | $11.4B | $412B | 2.77% | No |
A good free cash flow yield depends on growth. For a mature company growing slowly, a yield near or above the Treasury yield is reasonable. For a company growing free cash flow at 10% a year, a lower yield can still be fair. Market value here is the Nov 5 close times the latest share count on the 10-K or 10-Q cover.
Free cash flow vs earnings: which should you use?
Use both, for different jobs. Earnings tell you how profitable the business model is. Free cash flow tells you how much of that profit is available today and whether the company is paying for its own growth.
| Question | Net income / EPS | Free cash flow |
|---|---|---|
| Is the business profitable? | Good guide | Partial guide |
| Can the company afford its dividend and buybacks? | Partial guide | Good guide |
| Is profit inflated by non-cash gains? | Hides it | Reveals it |
| Is the company building heavily? | Hides it | Reveals it |
| Stable from year to year? | Usually | Often lumpy |
| Useful for banks and insurers? | Yes | No |
For a full valuation, free cash flow is the input to a discounted cash flow model. Our guide to what intrinsic value is and how to calculate it walks through one. For a quick price check, pair the P/E ratio with the FCF yield, and for banks use the price-to-book ratio instead.
Who should rely on free cash flow?
- Dividend investors: compare dividends paid with free cash flow over five years. A payout above 100% of free cash flow is funded by borrowing, asset sales or cash on hand, and cannot last.
- Long-term value investors: use free cash flow to estimate what a business is worth and to test whether a low P/E reflects real cash.
- Growth investors: watch the gap between net income and free cash flow. A wide gap is fine while investments pay off, but it should narrow as growth slows.
- Bank and insurance investors: skip it. Lending and deposits run through operating cash flow, so free cash flow swings with the balance sheet and says little about profit.
How much time and data does it take?
Checking free cash flow is free and takes about 15 minutes per company. Every number you need is in the cash flow statement of the 10-K on SEC EDGAR, and five years of history fit in a small spreadsheet.
What mistakes do investors make with free cash flow?
- Using one year: in their worst single years of the last decade, free cash flow fell 51.4% at Coca-Cola, 57.1% at Walmart and 148.8% at Exxon Mobil, by our calculation from their 10-Ks. A single year can mislead in either direction.
- Missing one-time items: Coca-Cola's 2025 free cash flow was $5.3 billion as reported and $11.4 billion excluding the fairlife payment. Read the notes before drawing conclusions.
- Ignoring stock-based pay: Microsoft's fiscal 2026 stock-based compensation was $12,405 million. Subtracting it cuts free cash flow from $66,987 million to $54,582 million, a truer picture of cash left for existing shareholders.
- Mixing definitions: Amazon subtracts capex net of asset sales and incentives, and other companies may exclude leases or add back items. Recalculate from the cash flow statement so every company is measured the same way.
- Treating negative FCF as failure: heavy investment can push free cash flow below zero in a strong business. Ask what the money is buying and what it should return.
Is free cash flow really better than earnings?
Not always. Free cash flow is better at showing what a company can pay out this year. Earnings can be better at showing how healthy the business is, because accrual accounting spreads big investments over the years they serve.
NYU Stern professor Aswath Damodaran makes this point directly:
"if your game is pricing stocks, I see little benefit from replacing traditional multiples (like PE and EV to EBITDA) with free cash flow scaled pricing measures. That is because a single year's free cash flow ... has more noise in it, and is less informative about a company's operating health, than a single year's earnings"
— Aswath Damodaran, Professor of Finance, NYU Stern School of Business, essay on free cash flow
Our data agrees with him on the noise. Microsoft's and Amazon's free cash flow fell while their earnings rose, and an investor who screened only on cash would have dropped both. That is the reason we treat free cash flow as a cross-check on earnings, not a replacement.
The TruthSayer Cash Conversion Check: five steps
We use these five steps to check a company's free cash flow before trusting its earnings. They take about 15 minutes with a 10-K.
- Calculate five years of free cash flow. Operating cash flow minus purchases of property and equipment, straight from each year's cash flow statement.
- Measure conversion. Divide free cash flow by net income each year. Above 80% is strong; below 50% needs an explanation.
- Find the reason for any gap. Is it rising capex, a one-time payment, working capital or non-cash gains? Read the cash flow statement and its notes.
- Adjust for stock-based pay. Subtract stock-based compensation to see the cash truly left for existing shareholders.
- Compare with the price and the payouts. Work out the FCF yield against the 10-year Treasury, and check that dividends plus buybacks are below free cash flow over five years.
A company that passes all five has earnings you can lean on. One that fails step 2 with no clear reason in step 3 deserves extra caution, whatever its P/E.
How does TruthSayer AI use free cash flow?
TruthSayer's Valuations AI does not buy stocks because their free cash flow yield is high. It combines proprietary fair-value models with price action, institutional activity and fundamental financial data to find potentially mispriced US-listed stocks, and every signal is traded in a funded account before members see it.
Microsoft shows why a single cash screen is not enough. Valuations AI bought Microsoft at $375.38 on April 8, 2026. At that price, Microsoft's free cash flow for the 12 months to March 31, 2026 was $72,916 million, an FCF yield of about 2.61% ($72,916 million ÷ ($375.38 × 7,428 million shares)). Its earnings yield on the same basis was 4.49%, and a screen for high cash yields would have passed it by. The trade closed at $517.51 on September 25, 2026, listed as a 37.82% gain over 170 days.
One trade proves nothing, so judge the full record. As of November 6, 2026, the Valuations AI page shows a 77.39% return since inception, a 72.1% historical win rate and an average hold of 78 days, and its trade list includes losing trades. TruthSayer AI claims compliance with GIPS®, the global performance reporting standard; see our GIPS reports and verification.
Free cash flow is operating cash flow minus purchases of property and equipment from each company's latest 10-K on SEC EDGAR, except Amazon, where we use the figure Amazon reports (capex net of proceeds and incentives). Market values use the November 5, 2026 close from Intrinio and the latest share count on each filing cover. Conversion ratios and yields are our calculations.
What should you do after you check free cash flow?
After you check a company's free cash flow, decide which of three cases you are in:
- Free cash flow tracks earnings: the earnings are real. Move on to valuation and set a buy-below price with a margin of safety.
- Free cash flow lags because of investment: estimate what the spending should earn and when. Check again after each 10-Q.
- Free cash flow lags with no clear reason: treat the earnings with caution and look elsewhere first.
To find candidates, read our guide on how to find undervalued stocks. Look up any unfamiliar term in our investing glossary, or see live undervalued and overvalued calls on Valuations AI.
The bottom line: Free cash flow shows how much of a company's profit is real cash you could be paid. Use it to check earnings, not to replace them: calculate five years, measure conversion, explain any gap, and compare the yield with the 10-year Treasury. When cash and earnings split, as they did at Amazon and Microsoft in 2026, find out why before you buy or sell.
Frequently asked questions
How do you calculate free cash flow?
Free cash flow equals net cash from operating activities minus capital expenditures, both taken from the cash flow statement. For Microsoft's fiscal 2026: $182,935 million − $115,948 million = $66,987 million. Divide by diluted shares for free cash flow per share, or by market value for the FCF yield.
Is negative free cash flow bad?
Not always. Negative free cash flow means a company spent more cash than it generated. That is a warning sign when operating cash flow is falling, but it can be a choice when a profitable company invests heavily. Amazon's 12-month free cash flow was −$42.4 billion to September 30, 2026, while its operating cash flow was $168.3 billion.
What is a good free cash flow yield?
A free cash flow yield near or above the 10-year Treasury yield, 4.90% on November 4, 2026, is reasonable for a slow-growing company. Fast-growing companies can justify lower yields if their free cash flow keeps rising. On November 5, 2026, Procter & Gamble's FCF yield was 3.91% and Microsoft's 1.68%.
Why is free cash flow lower than net income?
Free cash flow is usually lower than net income when a company spends more on new assets than it records as depreciation, builds up inventory or receivables, or books non-cash gains. Microsoft's fiscal 2026 free cash flow was 50.1% of net income, mainly because capex rose to $115.9 billion.
Is free cash flow the same as cash flow?
No. Operating cash flow is the cash a business generates from running itself. Free cash flow subtracts capital expenditures from that. Amazon generated $168.3 billion of operating cash flow in the 12 months to September 30, 2026, but its free cash flow was −$42.4 billion after $210.7 billion of net capex.
How often should I recheck free cash flow?
Recheck free cash flow every quarter, when the 10-Q comes out, using the trailing 12 months to smooth out seasonal swings. Do a full five-year review once a year with the 10-K. Recheck sooner if a company announces a large capital spending plan or acquisition.
Sources
- Amazon.com, Amazon.com Announces Third Quarter Results (Oct 2026)
- Amazon.com, quarterly results releases, Q3 2024 to Q2 2026 (2024–2026)
- The Coca-Cola Company, fourth quarter and full year 2025 results (Feb 2026)
- SEC EDGAR 10-K and 10-Q filings and XBRL data for Microsoft, Apple, Alphabet, Meta, Nvidia, Procter & Gamble, Walmart, Exxon Mobil, Coca-Cola and Amazon (filings through Nov 3, 2026)
- Aswath Damodaran, essay on free cash flow (PDF), NYU Stern
- Federal Reserve Bank of St. Louis, FRED, 10-Year Treasury Constant Maturity Rate (DGS10) (Nov 4, 2026)
- Intrinio, US equity closing prices (Cboe One) (Nov 5, 2026)
- TruthSayer AI, Valuations AI performance and trade list (Nov 6, 2026)
This article is for educational purposes only and is not investment advice. Past performance does not guarantee future results.
Joan Sacdalan
Joan specializes in financial data analytics, market intelligence, and investment research at TruthSayer AI. Her expertise spans fundamental and technical analysis, emerging market trends, and data-driven investment strategies, turning complex financial data into clear, actionable intelligence for risk-aware investors.